Basic Attention Token: Predictive Analysis
by Michael Marzec
Cryptocurrency has an unexplored quality that feels lost from the stock market. There are more unknowns. We are unsure if there is inherent value to cryptocurrencies or what future regulations might look like. Cryptocurrency is in its infancy with institutional investors actively questioning whether it will ever mature.
Furthermore, it can be difficult to fundamentally analyze various cryptocurrencies. Unlike the stock market, there are no regulations that require the associated cryptocurrency companies to disclose specific financial information. There are less hedge funds manipulating the market and there is less accessibility (although this is changing quickly) via trading platforms. Alternatively, for those interested and involved, there seems to be more opportunity for exploratory and innovative analysis.
Brave Browser
Released in 2019, Brave is a web browser intended to provide users privacy from the annoying (and often invasive) ads that track our browsing history. However, Brave allows users to opt-in and allow advertisements, which the users are subsequently rewarded for their ‘attention’ given to these ads via the ‘Basic Attention Token’ (BAT).
Logistically speaking, Brave gives users monthly BAT distributions which can subsequently either be kept in a digital wallet or returned as a ‘tip’ to the advertisers themselves. I have been a Brave user for over a year now and have grown to enjoy its interface. At the same time, I’ve been curious about the optimal use of my monthly BAT distributions. Should I hold them and see if they grow as the browser (hopefully) gains in popularity? Is there value in trading them for a more popular cryptocurrency like Bitcoin (BTC) or Ethereum? Or perhaps I’d be smart to cash them in (i.e., for USD) and use that money elsewhere. As such, I decided to conduct a portfolio-based analysis to see (based on the past year) what I should have been doing with my growing stash of BAT.
Objective
My objective is to evaluate which of the following strategies would provide the greatest financial return:
- Hold all BAT distributions.
- Immediately convert all BAT distributions to Bitcoin.
- Immediately convert all BAT distributions to USD.
- Use an ML time-series model (XGBoost) to predict BAT prices (in terms of USD) and trade accordingly.
Underlying Assumptions
I performed this evaluation using the date range of 1/1/2021 to 2/28/2022 but developed the solution with the intention to eventually progress it to an automated pipeline that provides daily updates of each strategy.
I presumed that I receive a distribution of 100 BAT on the first of every month. This is a huge exaggeration of my monthly distributions and assumes a consistent monthly amount, but it’s more fun to work with large numbers (and see Future Efforts for additional related thoughts).
Using ‘Open’ and ‘Close’ pricing for stock market analysis can be a bit more clear cut as the market opens and closes at 9:30am and 4pm EST. I used daily close prices for BAT and Bitcoin, which approximately represents midnight and 12:01am, respectively. I expand in my Future Efforts section, but for this to become a reliable measure of ROI, I would either need to automate any executed trades to occur at midnight or adjust my analysis to use whatever time of day I would prefer to manually trade at.
Data Extraction
Coinbase provides an easy-to-use API. By providing a symbol (e.g., BAT/BTC, which represents BAT value measured in terms of Bitcoin), start date, and end date (there are options for additional parameters per the API documentation), I receive a daily dataset that includes fields such as open, close, high, low, and volume. However, there were a few issues with the BAT data quality, so I resorted to temporarily using an export from Yahoo Finance (which I somehow had not realized Yahoo was now providing cryptocurrency data). Altogether, my dataset consists of ‘BAT/BTC’, ‘BAT/USD’, and ‘BTC/USD’ time-series data ranging from 1/1/2021 to 2/28/2022.
Exploratory Data Analysis (EDA)
During EDA, my goal was to explore pricing correlations and trends. When building a stock portfolio, it’s typically recommended to diversify. What this really means is that the investor should invest in stocks with inversely correlated prices. Inherently, if BAT and BTC are highly correlated, there should be less opportunity to trade against each other for gain.
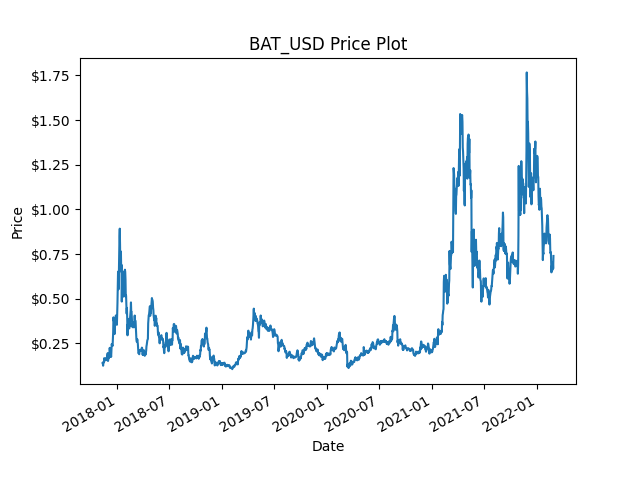
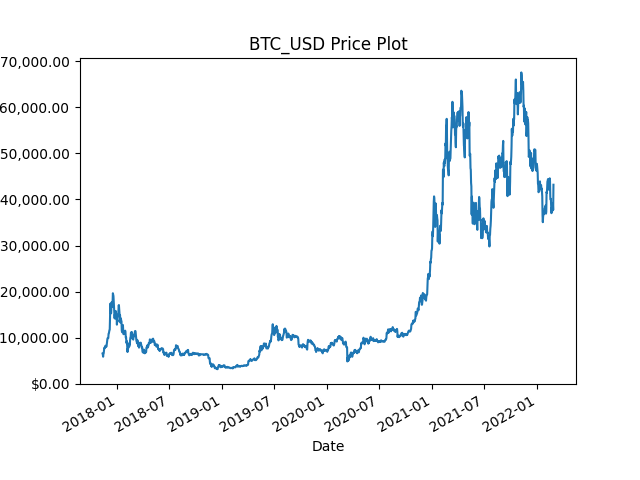
There is a lot of similarity between the following BAT/USD and BTC/USD price plots. While their y-scales are of course on different planes, they seem to trend together.
 |
 |
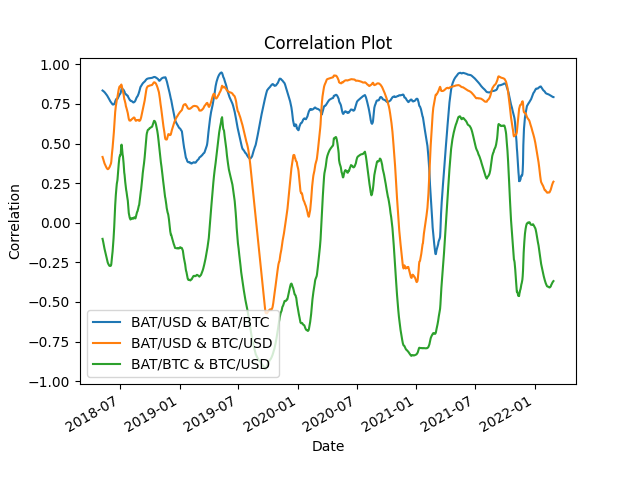
I also plotted their rolling correlations and a quick summary correlation table:
 |
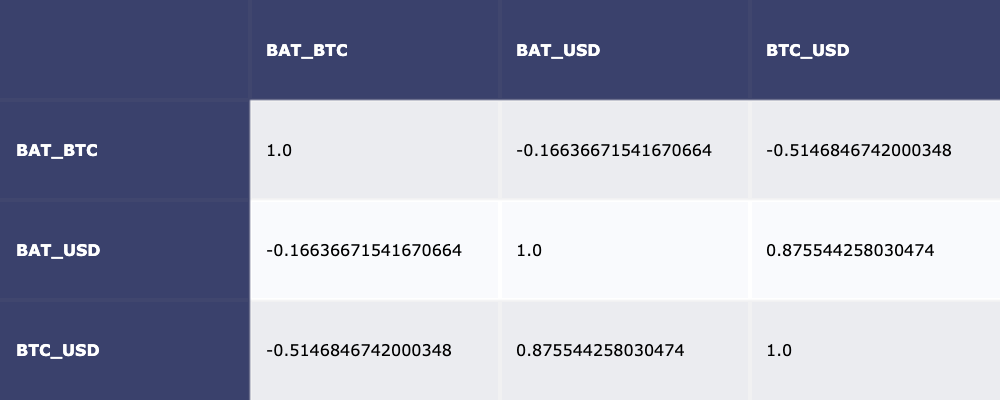 |
Quickly, we can see that BAT/USD and BTC/USD are highly correlated (87%). This indicates trading between the two likely has marginal upside. However, we can also see negative correlations between BAT/BTC and both BAT/USD and BTC/USD. Initially, I figured this is likely intertwined with BTC pricing (per USD) – I expand on this thought in the Future Efforts section. However, for now, I’ll focus on modeling BAT against the USD, rather than BTC.
Model Development
As mentioned in the Objective section, I created a function to evaluate each of the following:
- Holding all BAT distributions.
- Immediately converting BAT distributions to BTC (and holding).
- Immediately converting BAT distributions to USD (and holding).
- Using an XGBoost time-series model to trade between BAT and USD per analysis recommendations.
The ‘hold all investments’ function is relatively straightforward. On the first of every month, the function assumes that the portfolio receives 100 BATs and either adds it to the BAT total, or uses that day’s BAT/BTC or BAT/USD conversion rates to trade it for BTC or USD, respectively. It continuously adds these amounts through the life of the portfolio. The daily values are all based on that day’s conversion rate (i.e., if the portfolio would have 200 BAT on 1/15/2022 and each BAT was worth $0.50, then the portfolio’s value is $100).
An XGBoost time-series model requires a bit of nuanced curation. Linked is a useful walkthrough on a relatively straightforward application of XGBoost for time-series modeling (note that within the article, the ‘walk-forward validation’ function is inappropriately labeled … it’s actually an expanding-window function).
The key is structuring data to use the past X days to predict the future. The tricky (but absolutely necessary) part is to confirm that the model only uses historical data to predict future results. Typically, I would shuffle all of my data, split it into a train and test set, and train the model accordingly. However, I cannot randomly shuffle my data in this instance. If I were to shuffle all of the data, the training dataset could include data points that have occurred after the date of certain test data points. For example, if my dataset consisted of data from February and March, I need to use February data to train my model to predict March. In application, if I wanted to predict tomorrow’s price using the last seven days, I cannot use data from next week as of course that data has literally not yet occurred.
I discuss the results in the following ‘Model / ROI Evaluation’ section, but first I want to explain the difference between “Expanding-Window” and “Walk-Forward” validation. As described, it’s vital to use historical data to train time-series models, and these are two of the most common options to allow for proper model development.
The Expanding-Window method will use all available historical data while the Walk-Forward method will use a lookback window to determine the training dataset. See the following graphic for example:
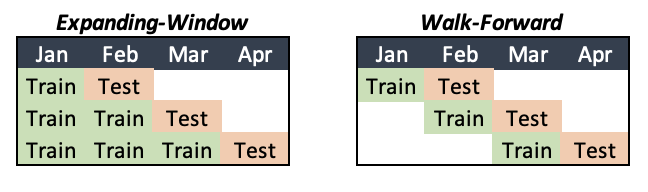
Assuming monthly data, the expanding window will continuously add to (i.e., expand) its training dataset, while the Walk-Forward method will ‘reset’ its training dataset to the most recently available month’s worth of data. In context, this decision can rely on the predictiveness and availability of historical data, and if the decision is unclear, there is no problem in testing both! However, as the model is retrained (e.g., monthly in this scenario), be sure to check the evaluation metrics as there is no guarantee that the performance will be consistent (hello model drift).
Model Evaluation
During my evaluation process, I considered the following parameters:
- Objective (XGBoost parameter).
- Number of Estimators (XGBoost parameter).
- Walk-forward vs Expanding-Window Validation.
- The number of days in my lookback period (when using walk-forward validation).
For objective and number of estimators, I ran a few custom GridSearches (i.e., iterating through various combinations of parameters) and frankly, the differences were barely noticeable. For objective, I tested squaredError and squaredLogError and for the number of estimators I tested options ranging from 100 to 10,000. With all else held constant, performance improvements were limited to about 1/100,000, so I decided to move forward using squaredLogError and 1000 estimators.
See the following for a table of my test results:
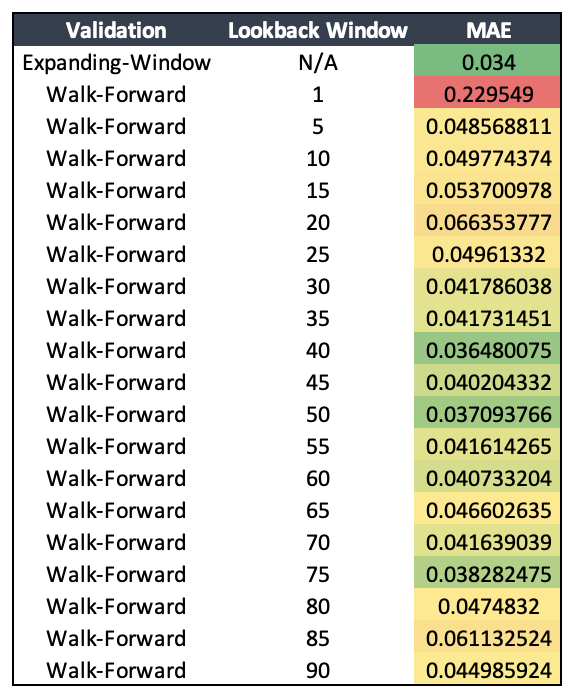
The results are fairly consistent, but the expanding-window provides the best measure. This isn’t shocking considering both the difference in training dataset size and the general lack of data in the walk-forward dataset. For comparison, in stock trading, windows can range from 1 to 10 years (if not more).
However, I lack confidence to use an expanding-window for this domain. It’s some mixture of my belief that the fundamental value of an unestablished cryptocurrency like BAT (which is reliant on a lesser-known browser like Brave) is (at best) in a constant state of high variance or instead is (at worst) altogether non-existent.
In stock trading, a ‘technical’ strategy tends to rely on short-term data (i.e., recent history), while a ‘fundamental’ approach relies on longer-term data (i.e., the theoretical intrinsic value of the company). Whether or not it’s a fair translation, I’m going to apply this logic here too. Regarding window size, per the results, using 30 days of data is a simple round number (i.e., one month) with relatively effective results and intuitively seems like a proper starting window.
ROI Analysis
To evaluate ROI, as mentioned, I converted each of the four ‘portfolios’ to USD. First, I compared the three ‘holding’ strategies:
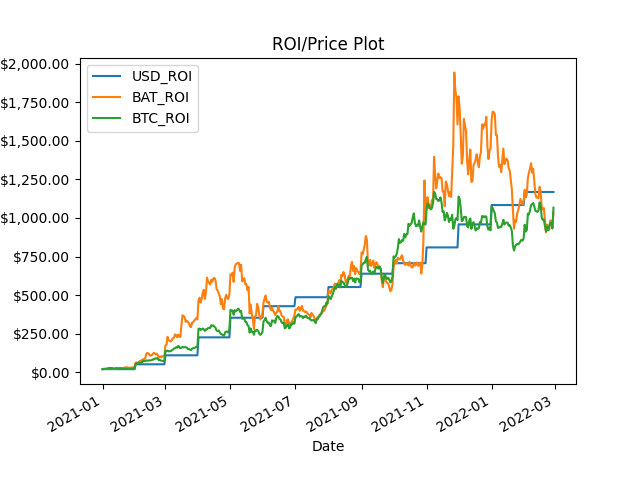
As expected, the USD approach provided the most stable results and even finished with the highest value. However, while holding BAT was clearly the most volatile approach it also at moments provided the highest value by a significant margin (reaching nearly $2,000).
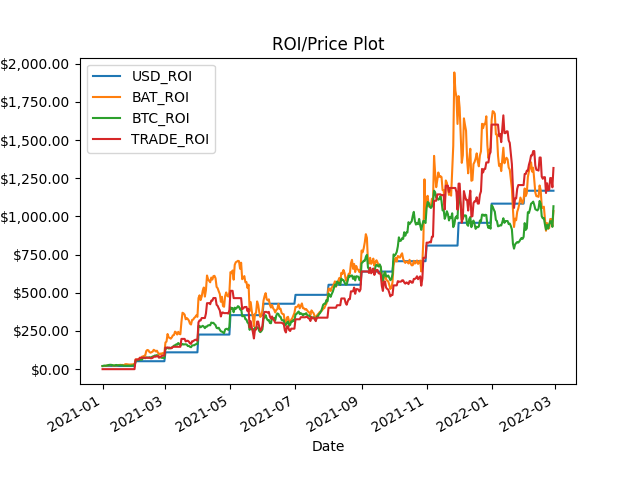
Subsequently, I added the trading strategy results:
 |
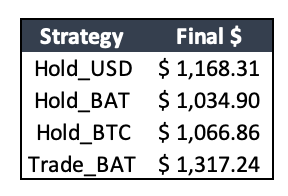 |
The trading strategy returned the highest value on the final date. However, per the visual, it seemed to follow the volatility of holding BAT, although it may slightly diminish BAT’s excessive volatility. I believe this needs further evaluation (which I discuss in the Future Efforts section), however, at the moment, this project is more proof-of-concept than it is a final production implementation. And as such, while there are updates to be made, areas of research to pursue, and a few other random thoughts that might help find an optimal strategy, I believe this upfront research lends credence (but not overwhelming evidence) to the thought of day-trading BAT.
Future Efforts
- Implement an automated pipeline
- My next objective is to implement a fully automated end-to-end pipeline. I envision using AWS Lambda to schedule a daily data extraction and a daily model retraining.
- I would like to add a simple front-end (likely a Flask page hosted using Zappa) that can visualize model metrics and ROI tracking.
- Additionally, I’d like to update the pipeline to extract the amount of BAT I actually collect each month (rather than the parameterized 100 BAT).
- Implement automated trading and/or notifications
- Using the Coinbase API, I could automate trades per the model’s recommendation. This would allow the actual trades to remain aligned to the analysis (i.e., so they can occur at midnight).
- Alternatively, I could automate a notification (e.g., email or text) if there’s a recommended trade alert.
- XGBoost Updates
- There is certainly value in investing more time evaluating the model. These thoughts include:
- Expanding my lookback period testing
- Testing against metrics other than MAE, including using ROI as an evaluation metric.
- Implementing error visualization (or other methodologies) to identify directional error (i.e., if predictions tend to be too high or too low).
- I’d like to experiment with predicting beyond the next day. As you predict further into the future, results are inherently less accurate, and considering the day-to-day trade approach, I’m skeptical how much value this could add.
- That said, there is likely value in optimizing my trading strategy, even if it’s only a week forward worth of predictions.
- There is certainly value in investing more time evaluating the model. These thoughts include:
- Other Trading Thoughts
- There is one critical missing piece to the ROI analysis: tax rates. All gains and losses can be offset (there are no wash sale regulations on crypto trading … yet). However, gains are taxable which inherently would reduce the ROI.
- There are lots of other usable indicators to suggest when to buy/sell. I’d like to experiment with volume analysis and variance analysis, which can include indicators like on-balance volume, CCI, momentum, and simple-moving average.
- Finally, I need to think through how to implement bitcoin as an option for the trading strategy. At first glance, I think this is where implementing a longer prediction period (e.g., a week into the future) could be beneficial. Alternatively, the instability of predicting further into the future could add volatility to the trading strategy that might ultimately reduce its effectiveness.
Thanks for reading, and if you have any comments or questions please feel free to reach out via email (michaelmarzec11@gmail.com)!