NBA-Winning Time: Introduction
by Michael Marzec
nbawp.com
A basketball team’s performance is captured by the end result: whether a team wins or loses. Zooming in, analysts, fans, and curious NBA observers alike will evaluate performance through more detailed lenses, such as a team’s ‘Point Differential.’ Point Differential is the average of a team’s difference in final score across their games played. To many, this is a more insightful analysis of a team’s performance than their win-loss record, as simply put: good teams tend to win by more than bad teams, and great teams tend to win by more than good teams. However, like wins and losses, Point Differential focuses on the final score. I propose we take a look at every moment of a basketball game to better capture a team’s performance.
Background
As a fan of the Minnesota Timberwolves, I was growing frustrated but also confused by the team’s performance in the 22-23 season. Anecdotally speaking, it seemed that the Wolves often led for a significant portion of the game but lost the lead (and game) late in the fourth quarter.
I felt like I was balancing two competing data points when trying to evaluate their performance:
- They were better than their record indicated, as I believed they were winning for the majority of the time that they played basketball (but without quantitative evidence).
- They were exactly as their record indicated (42-40), as their 0.5 Point Differential suggested an expected 42.3 wins.
As such, I set out to quantitatively capture if they were actually winning for the majority of the time that they played basketball, and if so, was it meaningful?
Objective
My goal was to calculate what percent of time a team spends winning, losing, or tied aggregated across every game played. In addition, I wanted to understand if this information is impactful. In other words, like Point Differential, is a team’s ‘time spent winning’ (moving forward, I will call this Winning Time) predictive of in-season or post-season success? Similarly, assuming that certain teams over or underperform their Winning Time, why do they over or underperform, and what can it reveal about their team performance?
Methodology
At every moment of a basketball game, each team is either winning, losing, or tied. Thus, across a 48-minute NBA basketball game, I calculated what percent of the time each team spends in each category.
For example, if a game lasts 48 minutes (i.e., there is no overtime period), and Team A is winning for 45/48 minutes, losing for 2/48 minutes, and tied for 1/48 minutes, the results are as follows:
- Winning Time: 93.75% (45/48)
- Losing Time: 4.17% (2/48)
- Tied Time: 2.08% (1/48)
To generate this data, I implemented a nightly AWS Lambda function that calculates each team’s winning, losing, and tied time and aggregates the results across each team’s season-long results. This data is then fed to nbawp.com, which includes the aforementioned fields, along with each team’s actual wins, losses, Point Differential, expected wins based on Point Differential, and a comparison of Winning Time against Point Differential and Winning Percentage (all data are sourced from cleaningtheglass.com and basketball-reference.com).
Exploratory Analysis
With a fairly significant caveat for sample size (I calculated Winning Time for only the 22-23 and 23-24 seasons), I conducted preliminary analyses to better understand the potential impact of Winning Time. Please note that all 23-24 data is as of 1/15/24.
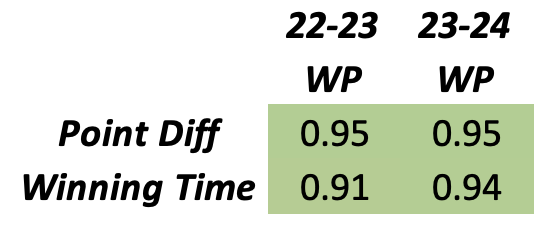
First, I took a simple look at the relationship between Winning Time and in-season (as opposed to post-season) NBA Winning Percentage. Slightly to my surprise, Winning Time was neck-for-neck with Point Differential regarding its correlation with in-season NBA Winning Percentage.
As you can see in the following table, Point Differential had a 95% correlation with Winning Percentage in both seasons, while Winning Time had a 91% and 94% correlation in the 22-23 and 23-24 seasons, respectively. Seeing as I built a new metric on a bit of a whim (relative to an already widely accepted metric in Point Differential), I did not expect it to compare so similarly.
 |
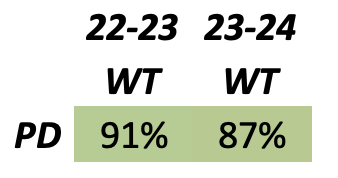
Consequently, as expected, Winning Time and Point Differential were highly correlated in the 22-23 and 23-24 seasons at 91% and 87%, respectively.
 |
This stoked a new curiosity: Can Winning Time and Point Differential provide any conceptually contrasting insights? Or, is Winning Time simply a similar (but most likely less predictive) indicator of a team’s performance? More on this later.
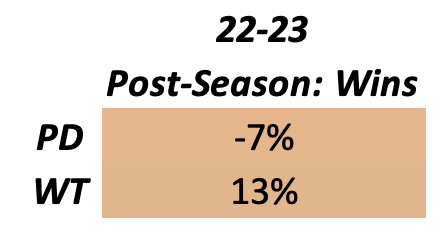
Regarding post-season performance, I am evaluating post-season data from a single season (22-23), in which the most games played by any team is only 25 (by the Miami Heat) and the average games played is 10.8. Due to this, I am tentative to post this information altogether, however, caveat aside, the following results show (in my opinion) that the weak correlations are more representative of a need to expand the dataset than any substantive takeaway.
I used post-season wins (as opposed to Win Percentage) as total wins better represents a successful post-season since a team that advances further into the playoffs (the ultimate objective) can win more games than one that loses in an earlier round. For example, in the 22-23 playoffs, Philadelphia had the second-highest Winning Percentage at 63% due to their first-round sweep despite subsequently losing in the second round.
As seen below, regular-season Winning Time was inversely correlated with post-season wins at -7%, and regular-season Point Differential was correlated with post-season wins at 13%. Again, for the analysis to become meaningful, I believe it requires post-season data aggregated over various seasons.
 |
Outliers
While I lack any evidence that Winning Time better explains NBA team success than Point Differential, as mentioned, my underlying objective was to unearth a fresh perspective on NBA team performance. As such, I looked at outliers: specifically, teams that won or lost significantly more or less than their Winning Time suggested.
For example, during the 22-23 NBA season, the 76ers (14.2%), Nuggets (9.8%), and Kings (9.5%) won significantly more than their Winning Time suggested, and alternatively, there were teams like the Rockets (-5.8%), Wizards (-5.8%), and Pistons (-6.2%) who lost more than their Winning Time suggested. To be clear, when using the 76ers as an example, their 14.2% is derived from their Winning Percentage (65.9%) minus their Winning Time (51.7%).
I wrestled with both ends of this spectrum. These teams either scrounged victories despite spending a significant portion of their games without the lead or lost leads that they created game after game. I poked around at various hypotheses, including offensive versus defensively oriented teams, variance-inducing metrics, such as pace, three-point rates, and assist-to-turnover ratios, and numerous explanatory metrics, such as their four-factors and shot profiles (both location and efficiency), all to no avail.
I also considered the myriad nondescript and over-prescribed narratives that I could build. The idea that some amorphous ideology like a team’s desire, grit, or backbone willed them to climb one insurmountable deficit after another to scrap their way back into various last-second wins. Believe it or not, I passed on these plot lines.
I also wondered if this phenomenon could somehow be attributed to the NBA’s rubber band effect. Perhaps these teams “leverage” the rubber band effect to slingshot themselves back into the lead and subsequently are better suited to holding that lead later in the game. This felt like grasping at straws, yet it delivered me to my only semi-conclusive evidence-based answer: clutch performance.
Clutch Performance
I decided to evaluate if there was a correlation between the delta of Winning Time and Winning Percentage with an NBA team’s clutch performance. I used the NBA’s clutch numbers, as defined by nba.com (last five minutes with a difference in score of 5 points or less).
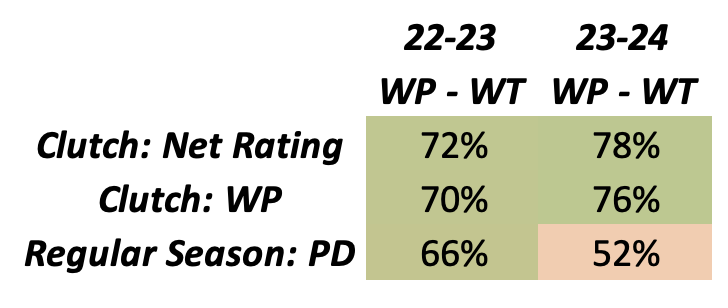
As you can see below, in 2022-23, a team’s clutch net rating has a 72% correlation with the difference between Winning Percentage and Winning Time, and a team’s clutch Winning Percentage was 70% correlated. In comparison, the team’s regular season Point Differential was slightly less correlated at 66%.
Looking at 23-24, this gap is significantly wider. The clutch net rating and clutch Winning Percentage are similarly correlated with the difference in total Winning Percentage and Winning Time at 78% and 76%. However, the regular season Point Differential’s correlation was only 52%.
This indicated that teams who significantly over or under-performed their Winning Time are likely doing so due to their clutch performance. There’s a lot more to be researched (and said) about the long-term implications (i.e., the predictive power of this discovery), but I still find this correlation interesting!
I mentioned my frustration with the 22-23 Minnesota Timberwolves as a motivating factor for this research. Looking at their 22-23 season, they were the sixth-ranked team by Winning Time, however, possessed the fifth-worst delta for underperforming their Winning Time (54% Winning Time and 51% Winning Percentage). Additionally, they were league-average in clutch net rating. In other words, Minnesota was a league leader in leading for a large majority of their games, but perhaps due to their average performance in the clutch, won a much lower percentage of games than their Winning Time otherwise indicated. While this isn’t a perfect justification of my anecdotal evidence, it feels at least a bit vindicating.
Additionally, looking at the season in progress, the largest over-performers are Minnesota (1st in the Western Conference), Philadelphia, Milwaukee, and Utah. Minnesota is the surprise of the season so far, which perhaps bodes well for their playoff hopes. The Bucks and 76ers are championship contenders. And Utah is in the middle of a hot streak. After the season, I will check back in to see if this indicated that Utah (and maybe Minnesota) are likely to ‘regress to the mean’ or instead, continue their surprising hot streaks. In addition, Milwaukee and Utah both hold top-five clutch net ratings, while the 76ers and Timberwolves are both league average, perhaps an indicator that instead the 76ers and Timberwolves are leading candidates for regression to the mean.
Next Steps
Both this website and the complementary research are extremely preliminary and exploratory in nature. Regarding the next steps, alongside minor formatting and website functionality updates, I’d like to further calculate this metric historically to increase the underlying sample size for exploratory research. Without a doubt, the largest caveat to this analysis is the lack of historical data.
I’d also like to introduce another metric: Weighted Winning Time. The impetus to develop Winning Time was to better understand how a team performed throughout the game, rather than the aggregated output of said performance at the final whistle. However, Winning Time still restricts each moment of the game to a binary (winning or losing). Consequently, I believe factoring in the score of the game to essentially create an interaction term between Point Differential and Winning Time could further reveal the ‘trends’ of each game.
Finally, there is significant room left for substantive research on Winning Time’s impact. This analysis was mostly descriptive. I want to better understand if it’s in any way predictive of future performance, particularly of playoff results or a future season (while controlling for injuries, roster changes, etc.).
Altogether, I hope Winning Time provides a fresh perspective on NBA team performance and a new method to understanding team success.
Thanks for reading, and if you have any comments or questions please feel free to reach out via email (michaelmarzec11@gmail.com)!